Matplotlib Seaborn and bokeh
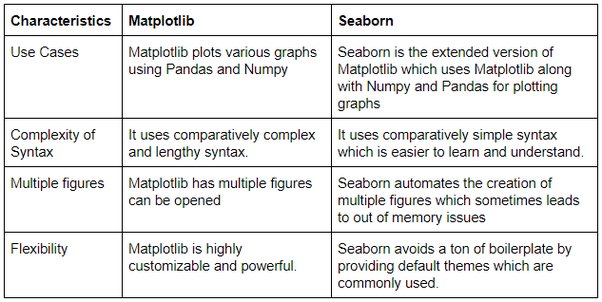
- Matplotlib is the most popular python package for 2d graphics, can do basic plotting.
- Seaborn is built on top of Matplotlib and has fancier visualization.
- bokeh is for interactive visualization, can handle plotting of data to the users.
**Matplotlib vs Seaborn**

**Simple Matplotlib example from readings**
import numpy as np # import numpy and set alias np

X = np.linspace(-np.pi, np.pi, 256, endpoint=True) # Numpy array with 256 values ranging from -pi to +pi
C, S = np.cos(X), np.sin(X) # display cosine and sine 2d figures.
**Chane colors and line widths**
# change S line color to read with line's width to 5, line style is solid.
plt.plot(X, S, color="red",  linewidth=5, linestyle="-")
**Subplot**
Plot partial data and display figures dividely.
**Axes**
Similar to subplot but allow placement of plot at any location of the figure.
**Set ticks**
Provide multiple ticks to suit data plotting.
**Moving spines**
tilt figures in the axis for better visualization
**Add legend**
plt.legend(loc='upper left', frameon=False)
**Annotate axis**
plt.annotate()
Animation
- drip drop
- earthquake
other references see this link: (credit: code fellows)